Wisconsin’s Democracy Explosion Partially Due to Sharply Split Views of School Success–Local vs. National
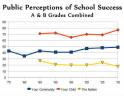
Over the past 25 years, parents have generally given high marks to the schools their children go to–between 70 and 80% A’s and B’s for most years. This is in sharp contrast to their views of schools in the nation at large, which are rated just the opposite–between 70 and 80% NOT A’s or B’s–with a sharp downward turn past 5 years. The views of local schools have fallen roughly half-way in between.
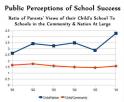
If we compare the views parents have of their own child’s school to those of schools in the community or the nation at large, this is how views of school success have changed over the years. As can be seen, the perception of schools in the community has remained fairly constant as a ration–parents have consistently given their own children’s schools A’s and B’s about 50% more frequently than they give similar scores to schools in the communities they live in. But the view of the nation’s schools has been both more volatile and more negative, with a sharp jump in negative views the last 5 years. Parents now give their own children’s schools A’s and B’s more than 4 times more frequently than they give those grades to the nation’s schools. Clearly, the overwhelming majority of Americans think their own children’s schools are well above average:
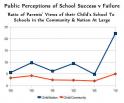
Perceptions of School Success vs. Failure
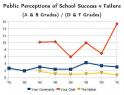
These results are only intensified if we look at a measure of success vs. failure: the ratio of A’s and B’s to D’s and F’s. Not only is the gap between parents’ perceptions of their own children’s schools and other schools more pronounced, the improvement in their perception of their own children’s schools has literally skyrocketed the last five years at the same time it has dipped for both schools in their community and in the nation at large:
The positive view of their own children’s schools is so strong, that in order to see their opinion of other schools, I’ve redone the above chart with their own children’s schools removed and the scale expanded:
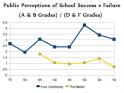
Again, we turn to our ratio comparisons. Looking at the ratios of perceived success vs. failure in other schools compared to their own children’s schools, we see relatively modest fluctuations in the views of community schools, significantly larger fluctuations in the views of the nation’s schools as a whole, and a truly mammoth spike since 2005, during which time the success vs. failure perception for the their own children’s schools skyrocketed from five times better than the nation as a whole to about 22 1/2 times better–a jump of 4 1/2 times:
Perceptions of School Failure
Page 2 of 3 | Previous page | Next page