Class warfare in action
Trends in income inequality relative to GDP
There are no clever mathematical models here, only facts. No Nobel prize for me.
I analysed income per family divided by GDP per family. First look at the 90% majority:
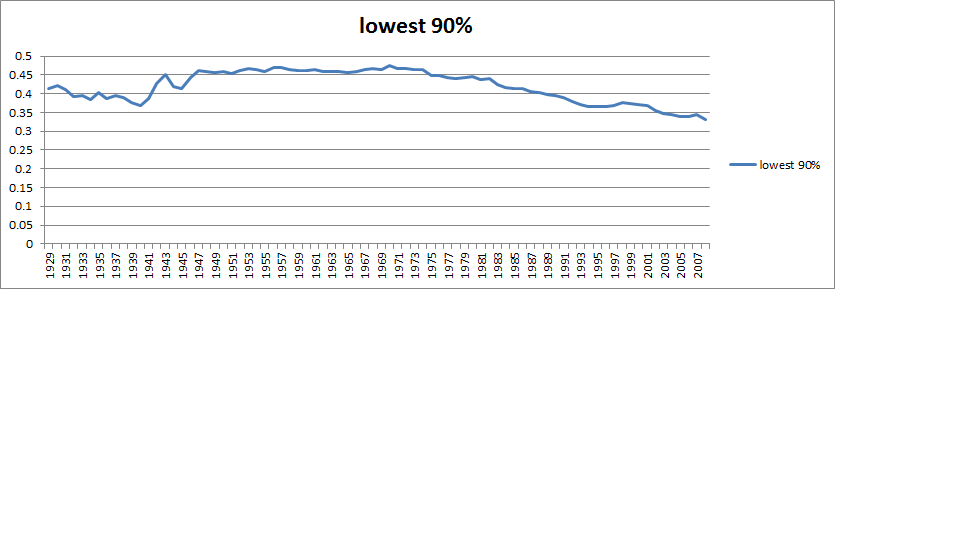
Income per family relative to GDP per family
Since about 1970, their average share of income relative to GDP has steadily declined, from almost half, to about a third.
The next chart (IncomeGDPTax.png) shows a number of things: first look at the lines for top tax rate and GDP per family. The tax rate does not significantly affect the GDP growth, which is steady apart from the stagflation period in the 70s which was followed by the technology boom of the 80s and 90s.
Cutting top tax rates does not stimulate GDP growth.
Next, look at the average income per family for a range of groups (see the right hand column of the legend). Observe the time correlation with the tax rate line.
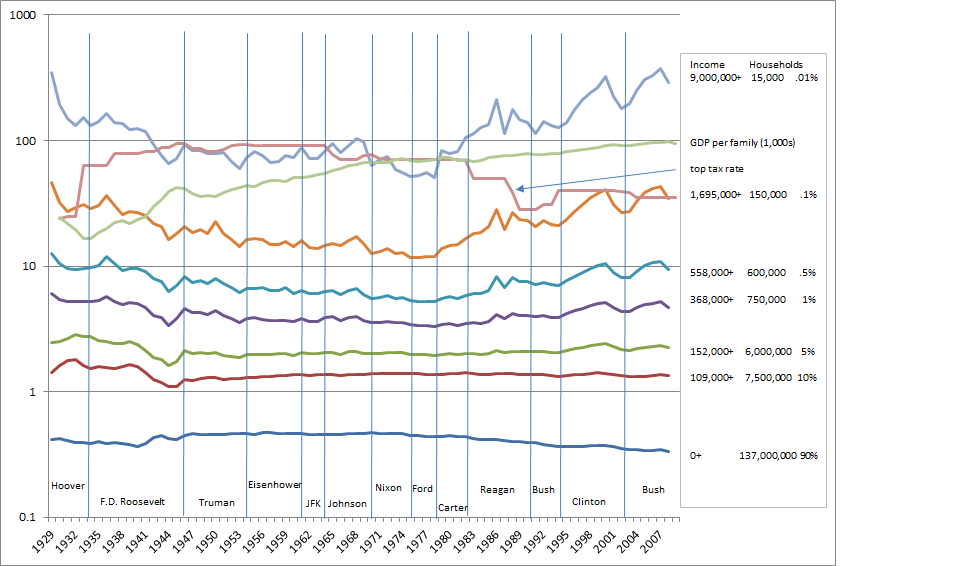
Income by groups compared to GDPP and tax rates
Reducing top tax rates transfers income from the majority to the very highest earners.
Sources:
Incomes: Alvaredo, F., Atkinson, A. B., Piketty, T. and Saez, E. The World Top Incomes Database, http://g-mond.parisschoolofeconomics.eu/topincomes, 14/05/2011
GDP: Bureau of Economic Analysis, http://www.bea.gov/national/nipaweb/TableView.asp?SelectedTable=5&ViewSeries=NO&Java=no&Request3Place=N&3Place=N&FromView=YES&Freq=Year&FirstYear=1945&LastYear=2010&3Place=N&AllYearsChk=YES&Update=Update&JavaBox=no
Tax rates: http://www.truthandpolitics.org/top-rates.php